General description
The spectrogram indicates the signal level using colors. Black and blue indicate that the frequency has little power and the red color indicates high power. If the gray scale palette is selected, white indicates high power and black low power frequencies. There are two slide bars at the top of spectrogram window. The left slide bar is used to adjust contrast (c) and the right one is used to control the signal base level (b). The pixel color is calculated using the following formula.
colorf = T(c*xf + b)
where
xf is the power at frequency f.
T is the mapping of power level to the color.
If the left mouse button is pressed over spectrogram window, frequency corresponding cursor position is shown in the bottom left corner. Left mouse button is also used to zoom wanted frequency band. ‘Zoom out’ selection from right mouse pop menu is used to expand frequency band after zooming.
If the right mouse button is pressed over spectrogram window, a popup menu is shown. Using the popup menu, the bitmap can copied to the clipboard.
Configuration
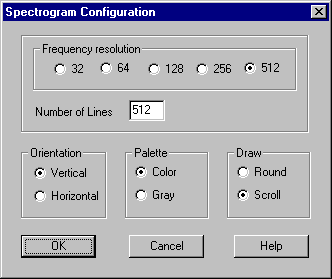
The configuration dialog is used to adjust the parameters. Push the Config button, which is at the top of the spectrogram window and the following configuration dialog is shown.
Parameters
frequency resolution
tells the resolution of the frequency axis. The resolution is given as powers of two because the Fast Fourier Transformation (FFT) algorithm is used.
Number of lines
parameter tells how many lines are drawn in the time axis. The number of lines and the sampling frequency tell how many seconds the signal is shown in the spectrogram window.
Orientation
If the orientation is vertical, the vertical axis is time and horizontal axis is the frequency. The orientation can be also horizontal, when axes are reversed. The frequency is in kHz. The time axis is in seconds.
Palette
256 colors and gray scale palettes are supported.
Draw
If the scrolling drawing method is selected, the oldest frequency values are scrolled out of the picture. Note that this method needs more computation power than the rounding method.
Save
The Save button is used to save the spectrogram picture in the bitmap format in a file. When the button is pressed, a save dialog is shown. Type a name for the bitmap picture and press the Save button.
Reset
The Reset button is used to clear the spectrogram bitmap window.
