General description
The Signal statistics block displays real time information about signal statistics. The user can select any of the following statistics to be displayed: power, average, minimum and maximum. The statistic is calculated over plotting period, which is about 250 samples.
Statistics are plotted on the screen, which is scrolled from right to left. The plot color of signal statistics can be selected from the properties dialog.
Increasing the size of history buffer the values from the past are kept in the history buffer. The horizontal scroll bar is used to display the old values. The time scale on the display is as seconds.
Configuration
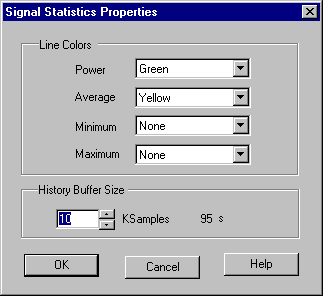
Pressing the 'Config' button opens the following configuration dialog.
Parameters
Power
The Power is the power of the input signal during plot period. The drop down list is used to select the plot color. If None is selected power is not plotted.
Average
The Average is the average value of the input signal during plot period. The drop down list is used to select the plot color. If None is selected, average is not plotted.
Minimum
The Minimum is the minimum value of the input signal during plot period. The drop down list is used to select the plot color. If None is selected, minimum is not plotted.
Maximum
The Maximum is the maximum value of the input signal. during plot period The drop down list is used to select the plot color. If None is selected, maximum is not plotted.
Display Commands
Pressing the right mouse button in the plot area, the pop down menu is opened. There are the following commands in the pop down menu.
Stop/Start
The Display can started or stopped
Auto Scale
When the Auto scale is enabled, display is scaled automatically in order to fit signal statistics optimally on the display. If autoscale is not on, the user can use the horizontal scroll bars to adjust the extent and the signal DC level on the display.
Grid
When selected a grid is drawn on the display. The timescale is in seconds.
Copy to Clipboard
A plot on the display is copied on the clipboard.
Help
Context sensitive help about signal statistics display.
