Histogram Analyzer
General description
This is a tool for signal power and amplitude statistical analysis. It creates a histogram of different signal power values. This means, that in axis (Y) there are the number of values having the same power. The power value can be read from axis (X). It provides minimum, maximum, mean and standard deviation signal analysis.
Configuration
Pressing the right mouse button over the histogram display will open the following pop-up menu.
Parameters
Stop/Start
The histogram calculation and display updating can be started or stopped with this switch.
Auto scale
If this is switched on, the display is automatically scaled.
Zoom out
This returns the zoom to the original value.
Grid
This activates the grid in the histogram display.
Average
This activates the histogram value averaging in the display.
Maximum
This activates the "max and hold" function in the histogram display.
Update interval
This defines an interval for the display updates.
Properties
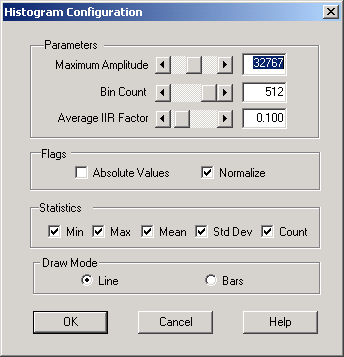
This opens the configuration dialog shown below:
The properties parameters are:
MAXIMUM AMPLITUDE
This is the scale for the ‘X’ axis in histogram display.
BIN COUNT
This is the number of different power levels in the ‘Y’ axis.
AVERAGE IIR FACTOR
This is the averaging filter parameter. If this number is small, the filter will be narrow. This parameter is active only when ‘Averaging’ is activated
ABSOLUTE VALUES
The histogram shows only the absolute values (these values are always positive)
NORMALIZE
The histogram maximum value will be normalized to 100.
MIN
If this is selected, the Minimum value will be shown on the display
MAX
If this is selected, the Maximum value will be shown on the display
MEAN
If this is selected, the Mean value will be shown on the display
STD DEV
If this is selected, the Standard Deviation value will be shown on the display
COUNT
If this is selected, the number of samples used in the analysis will be shown on the display
DRAW MODE
This defines the mode in which the results will be plotted (line/bar).
Copy to Clipboard
Copies the spectrum display to the Windows Clipboard
Help
Activates the help file
