General description
In phase (I) and Quadrature (Q) signal components are extracted from Intermediate Frequency (IF) signal by multiplying it with sine and cosine. After multiplication, I and Q components are low pass filtered in order to eliminate aliased components. I and Q samples are plotted separately into I and Q display. The user can select freely the carrier frequency from where down conversion is done. The user can adjust the bandwidth of IF signal with low pass filter. If signal is digitally modulated, the user can find the correct synchronization time by adjusting downsampling and the start offset parameters.
Configuration
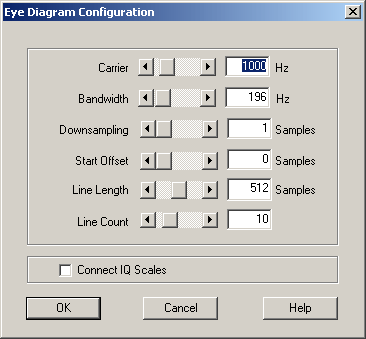
Pressing the Config button opens the following configuration dialog.
Parameters
Carrier
The carrier frequency from where IQ separation is done.
Band Width
The width of low pass filter which is used to filter I and Q signal after sifting the signal to the base band.
Down Sampling
Every N:th of the I and Q signals are plotted on the screen.
Start Offset
Plotting of the I and Q signals is started from N:th sample.
Line Length
The number of samples that are plotted for one line.
Line Count
Number of lines that are plotted into I and Q displays. The total buffer length for I and Q samples is Line Length x Line Count. The x coordinate of the i:th sample is calculated with the following equation.
Xi = S(d*i)+s mod L
where
S is the i:th sample in the I or Q buffer
d is the Down Sampling
s is the Start Offset
L is the Line Length parameter
Connect IQ Scales
If the check box is checked, the same scaling is used in the I and Q windows
Display Commands
Pressing the right mouse button in the plot area the pop down menu is opened. There are the following commands in the pop down menu.
Stop/Start
Display can started or stopped
Grid
When selected, a grid is drawn on the display.
Copy to Clipboard
A plot on the display is copied to the clipboard.
Help
Context sensitive help about Eye diagram display.
